Improving the CRM Connection Overview
The Brief
User story: How might we enable users to get a better and faster overview of their CRM integration status so that they can easily know how their connection with Vainu is doing?
Background: The product started to change more towards self-service. I did background research to understand how users use our connection settings and how we could improve them. Customer interviews pointed out that users didn't use the overview tab of the connection settings almost at all. They didn't find it useful and the purpose of the tab wasn't clear for them. I saw the tab could have a lot of potential to help users to understand better the status of their CRM connection and to guide users to get the best out of the integration. So I gave a better look to the overview tab and made improvements.
Tools: Figma, Invision
Issues With The Old Flow
-
![]()
The old connection status page
The old landing view of the CRM integration settings had a small status card that showed very little detail about the connection.
-
![]()
An Extra Click
To get better overview of the connection status and to edit settings, the user needed to click the small status card first.
-
![]()
Unused Overview Tab
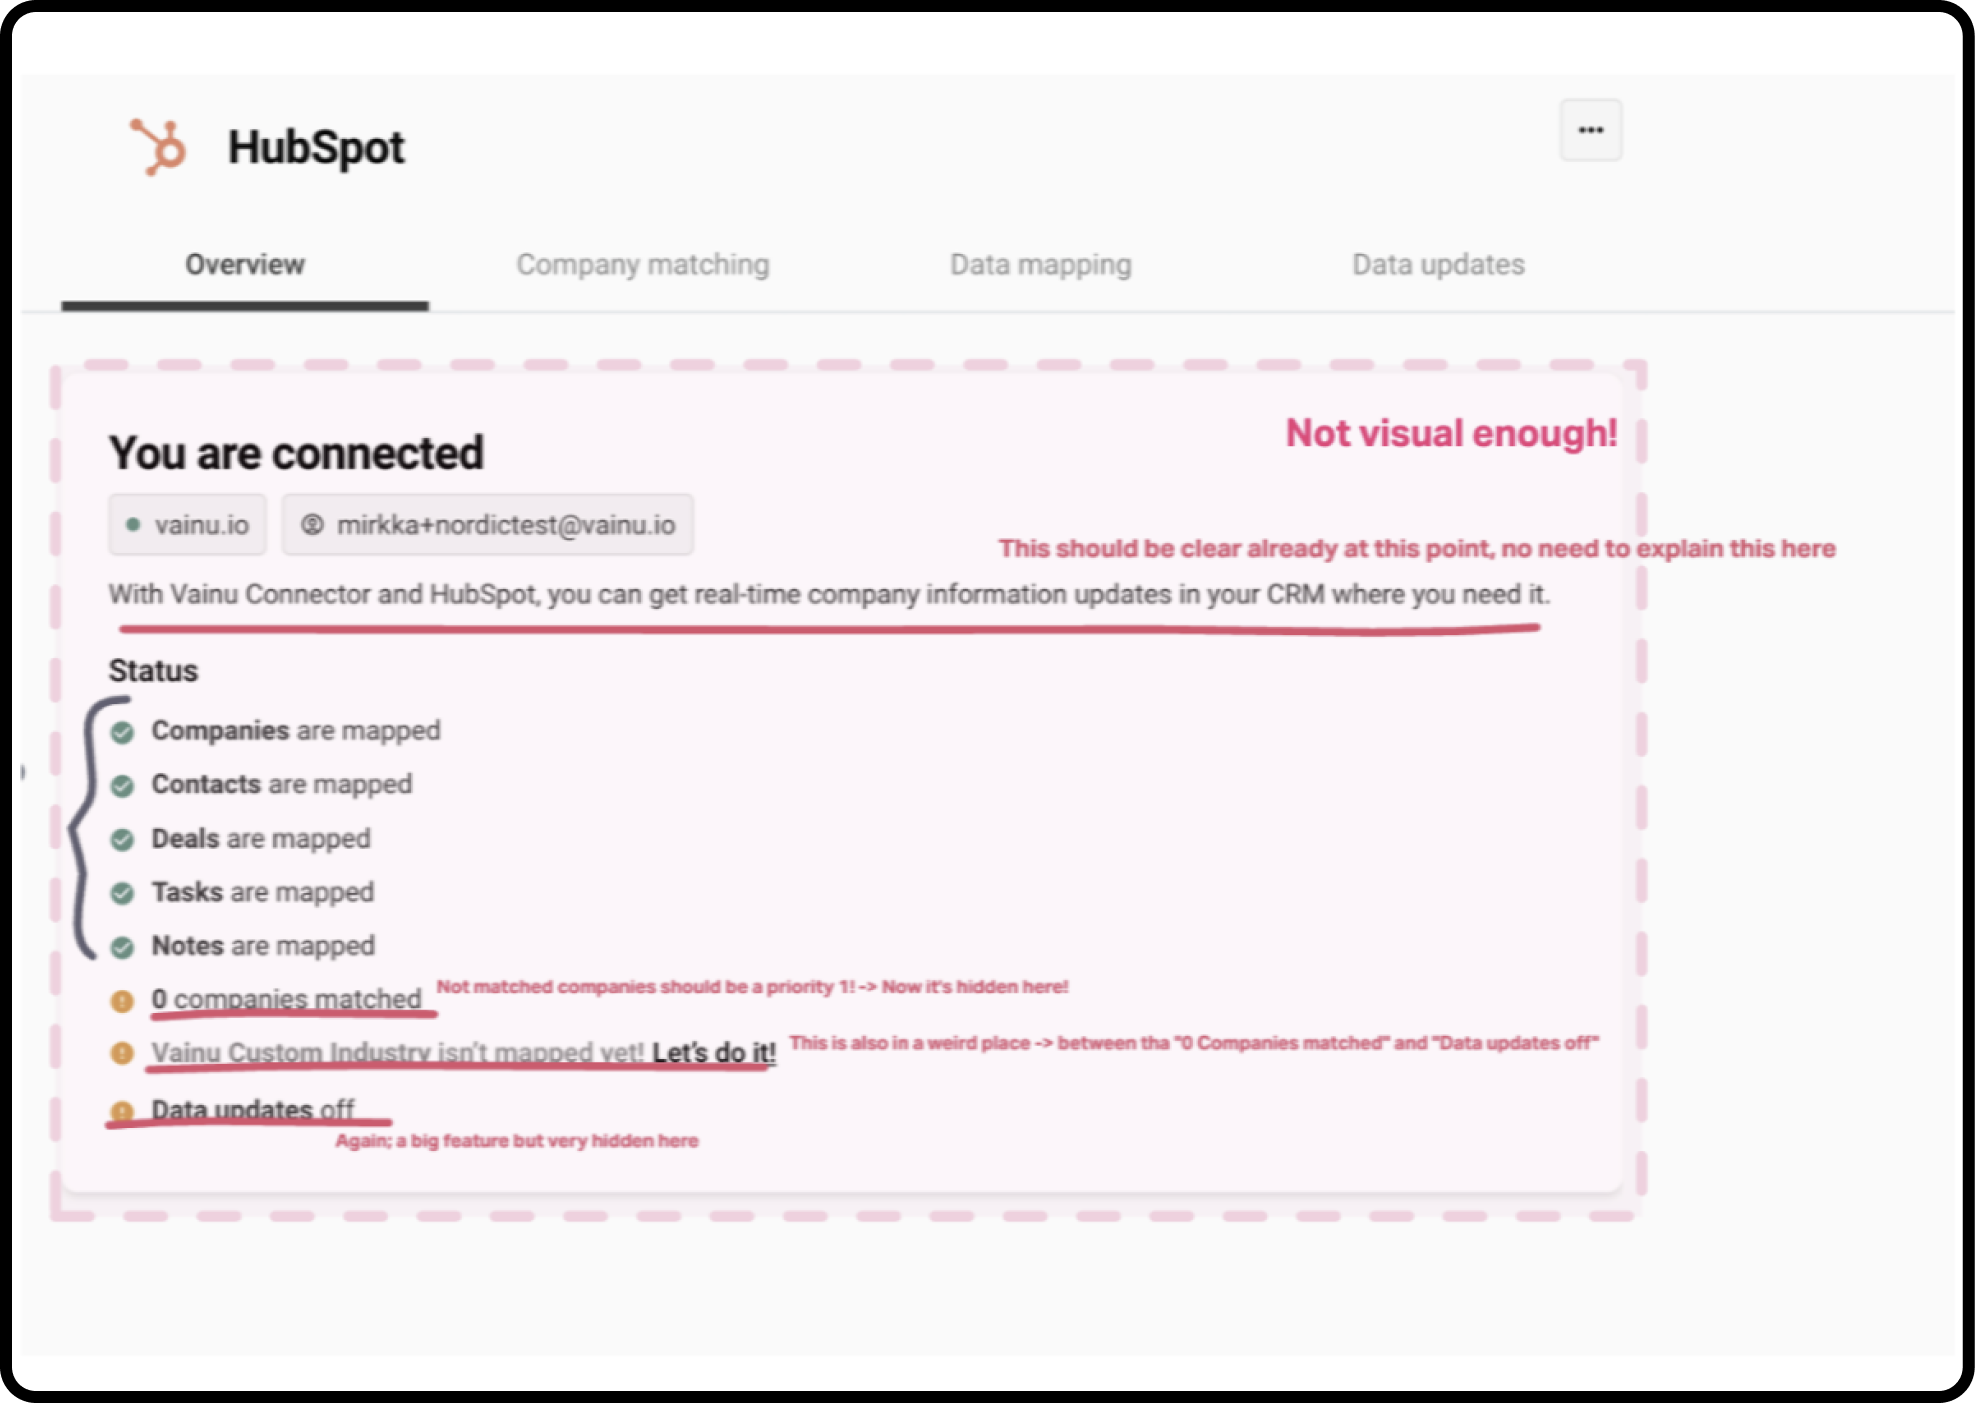
Interviews brought up an issue with the overview tab: users didn't use it and didn't understand its purpose. Also, reviewing different settings and getting a better understanding of them required multiple clicks on different tabs.
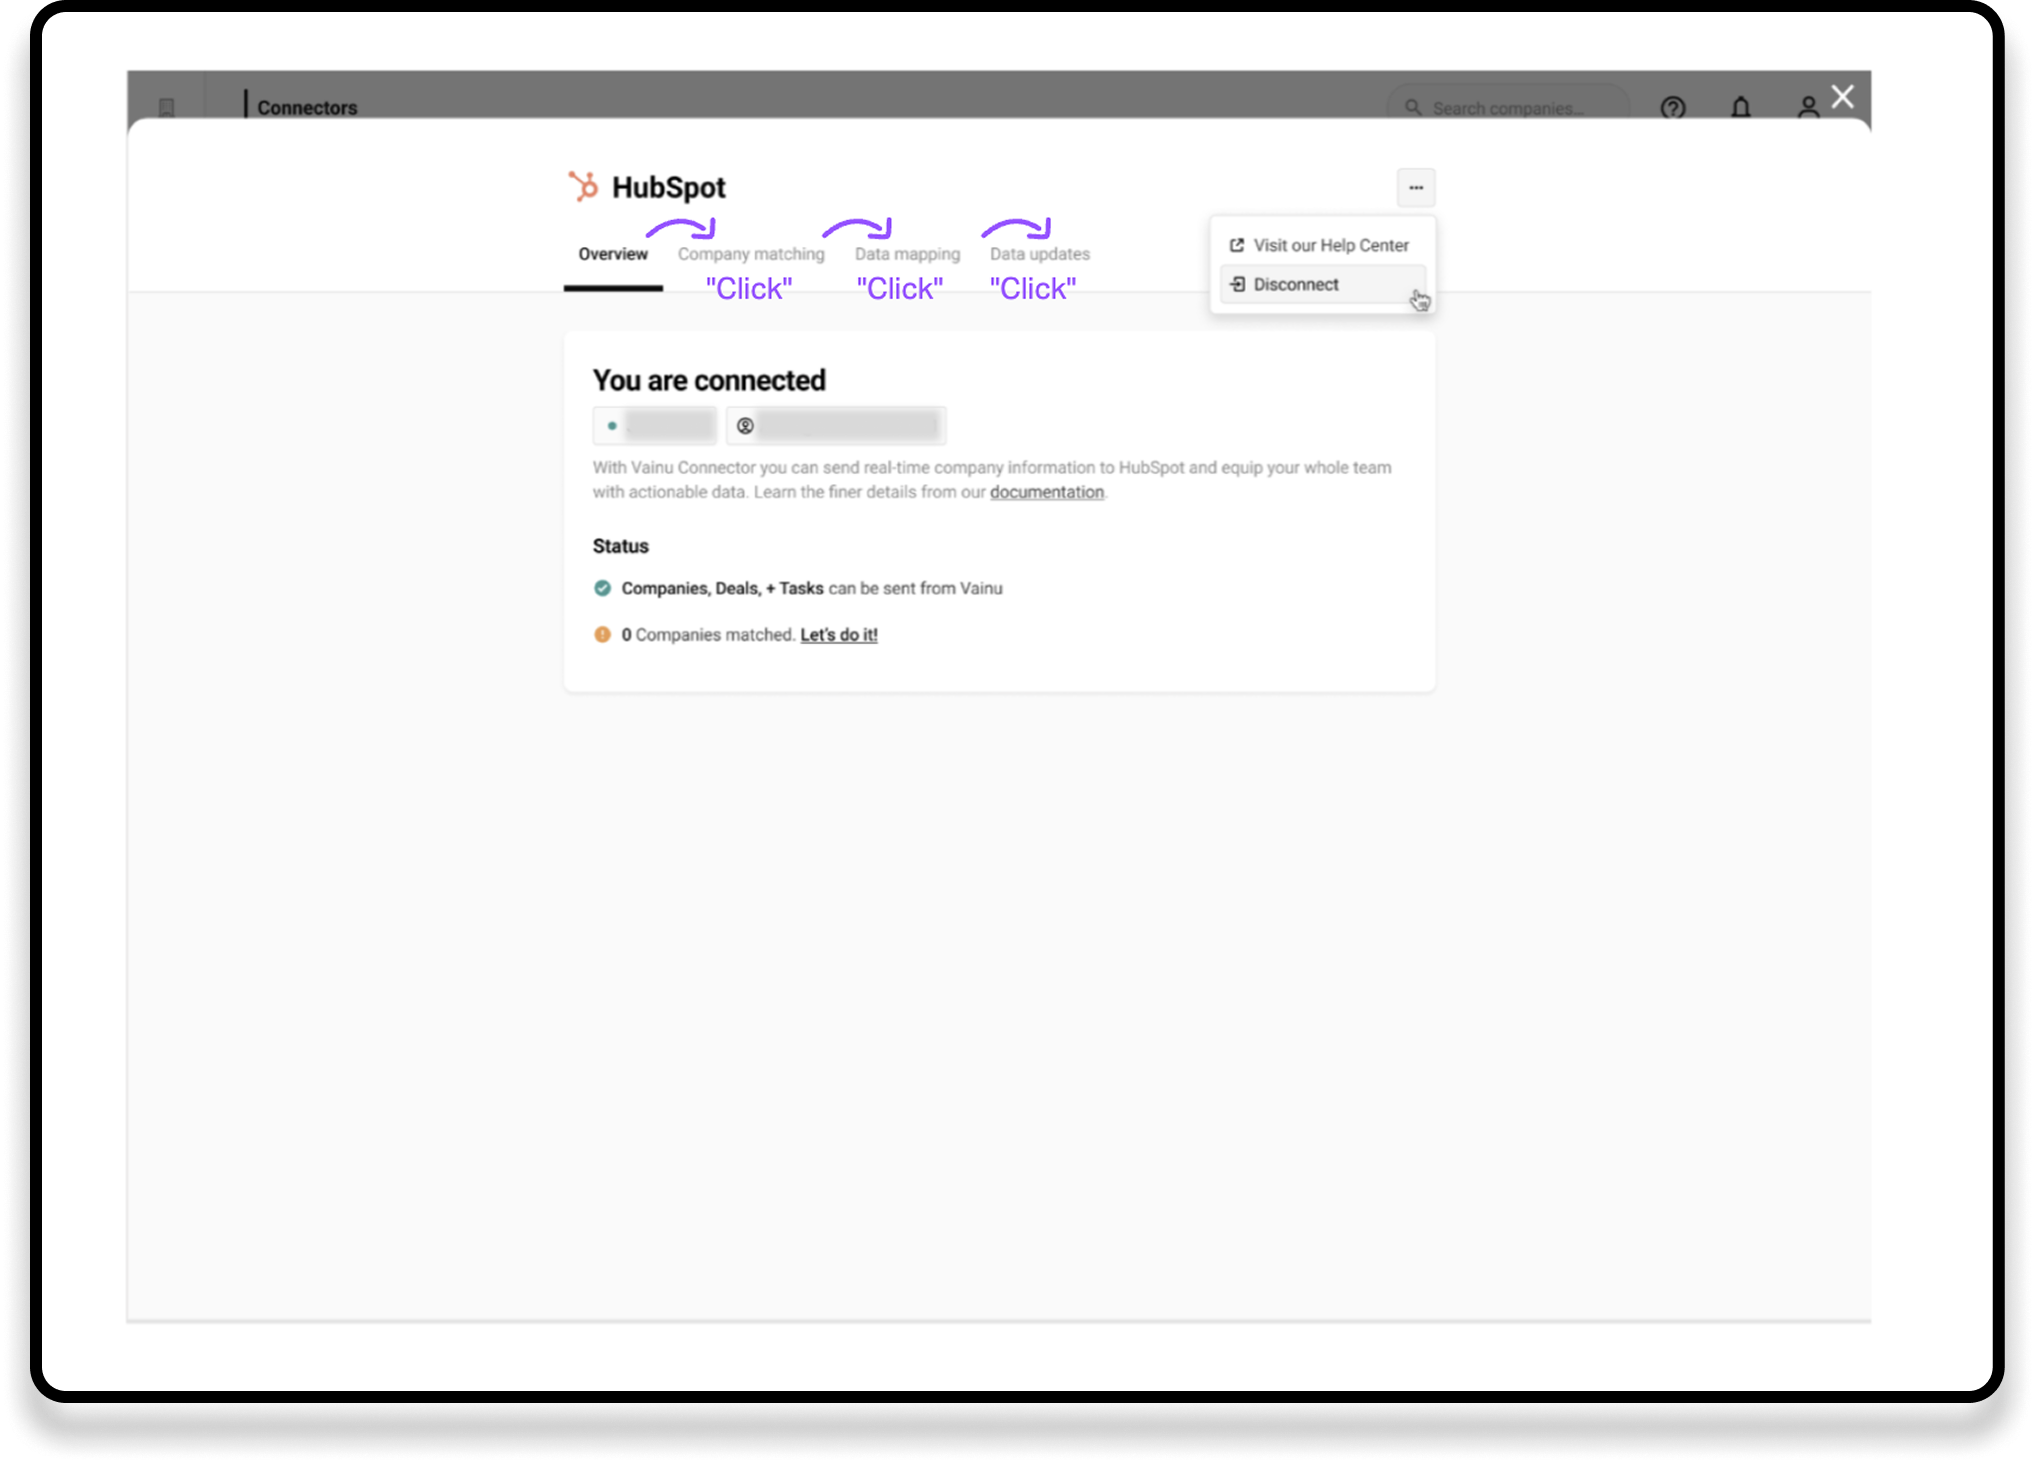
How could the overview provide more meaningful insights?
Customer interviews revealed that users rarely used the settings overview tab. They didn’t find it useful, and its purpose wasn’t clear to them.
However, I saw an opportunity to turn the overview into a more valuable part of the integration experience. It could help users understand the status of their CRM connection, guide them in getting the most out of the integration, and eventually enable self-service customers to review and manage their settings independently.
Based on these insights, I revisited the overview tab and redesigned it to make the information clearer, more useful, and easier to act on.
1. Hear the customers: Unused overview tab
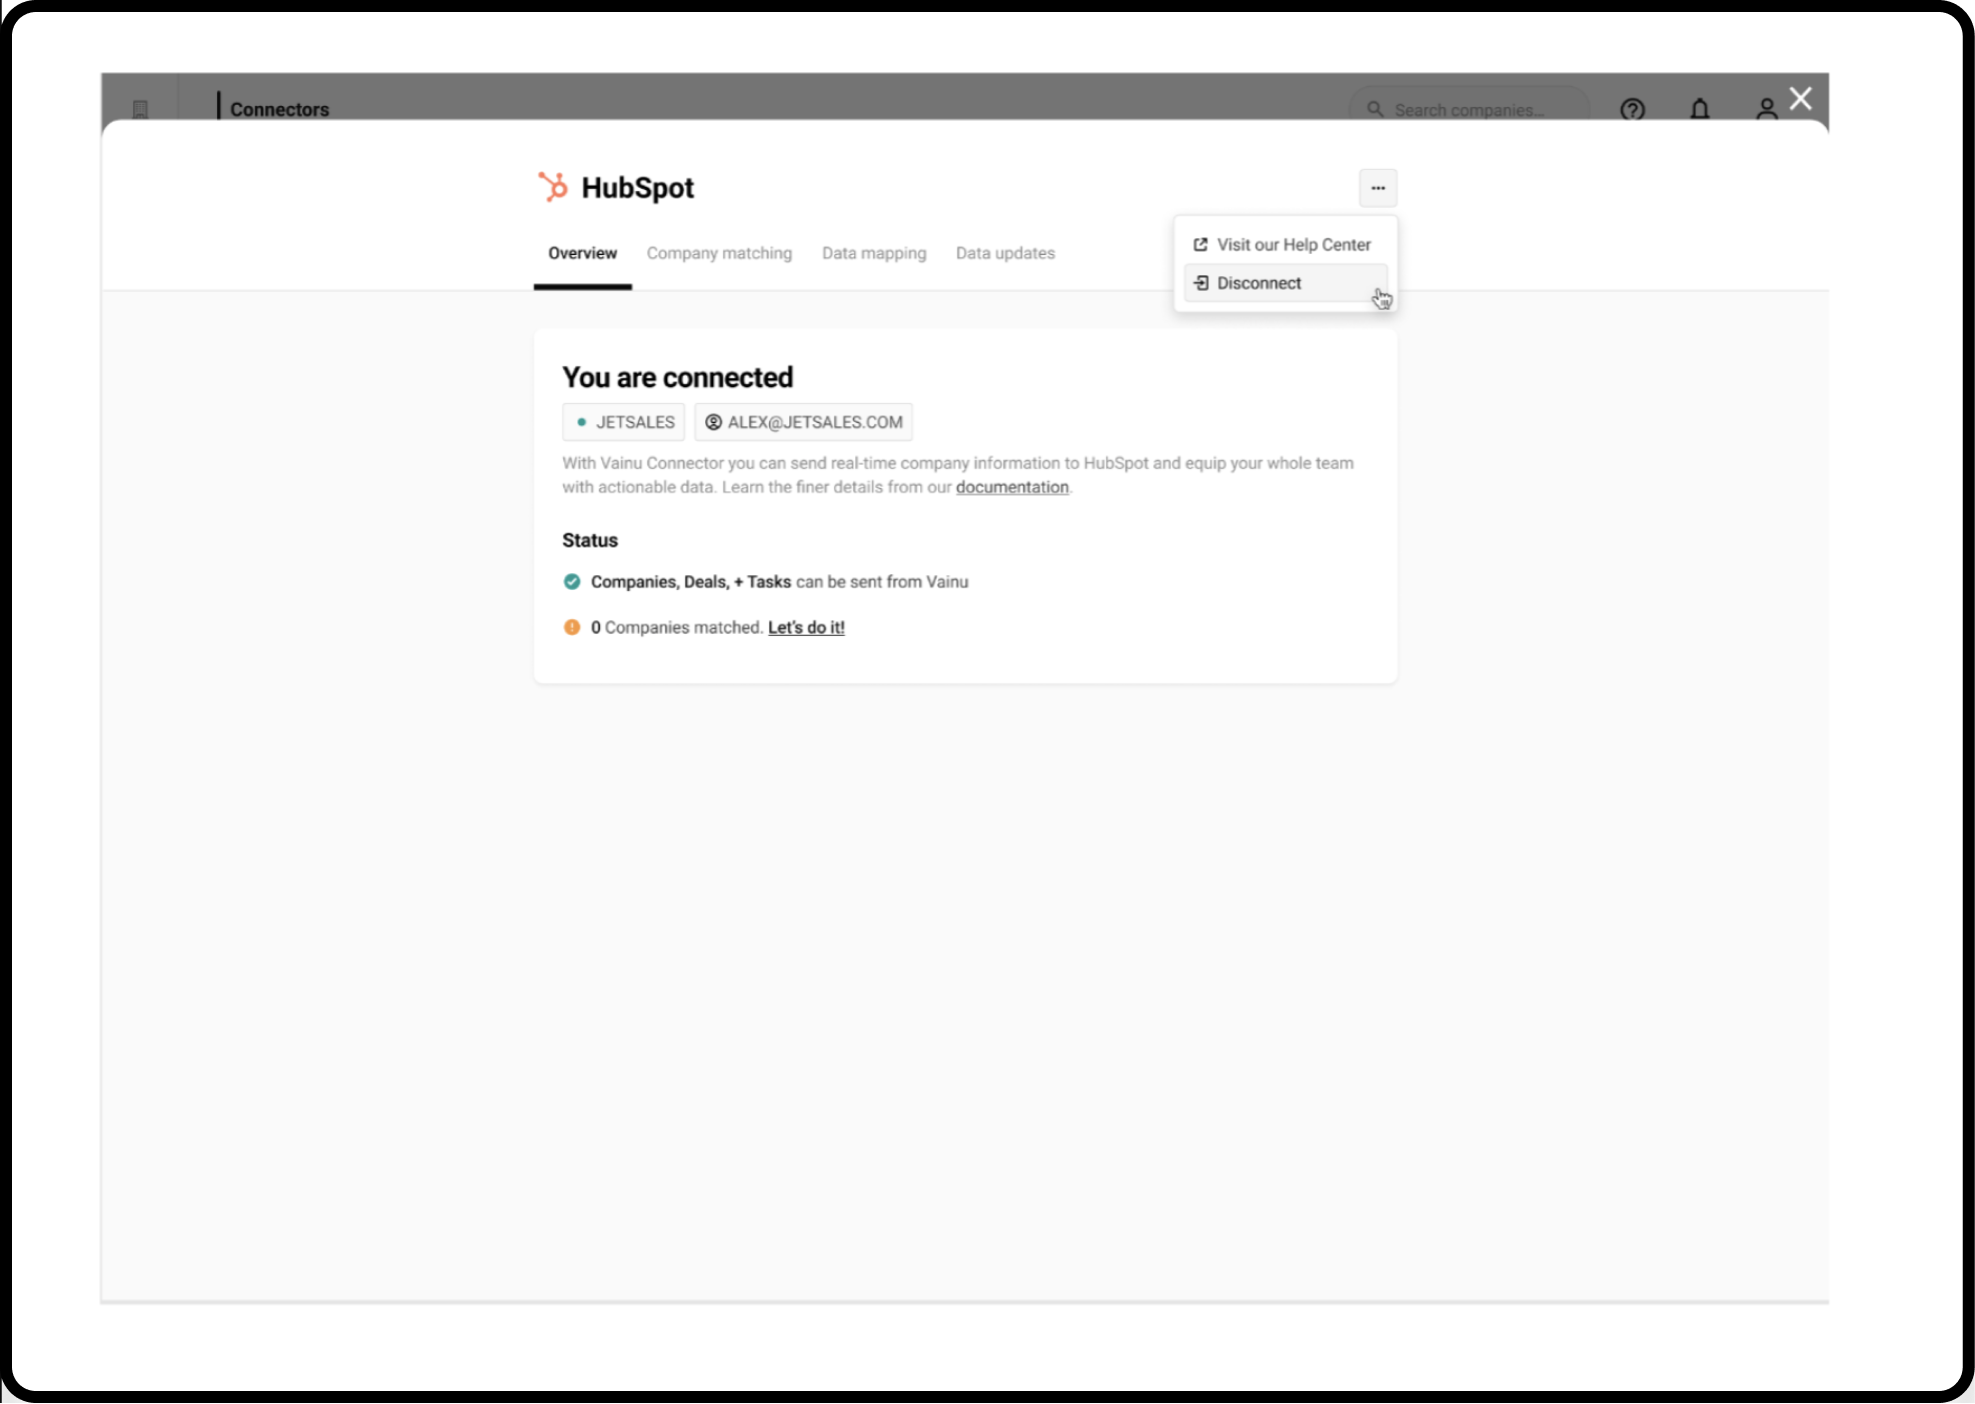
I interviewed customers to gain a deeper understanding of how they use the current settings panel. It became very clear that users didn't use the overview tab which should give a brief summary of the CRM connection status.
2. Understand the issue
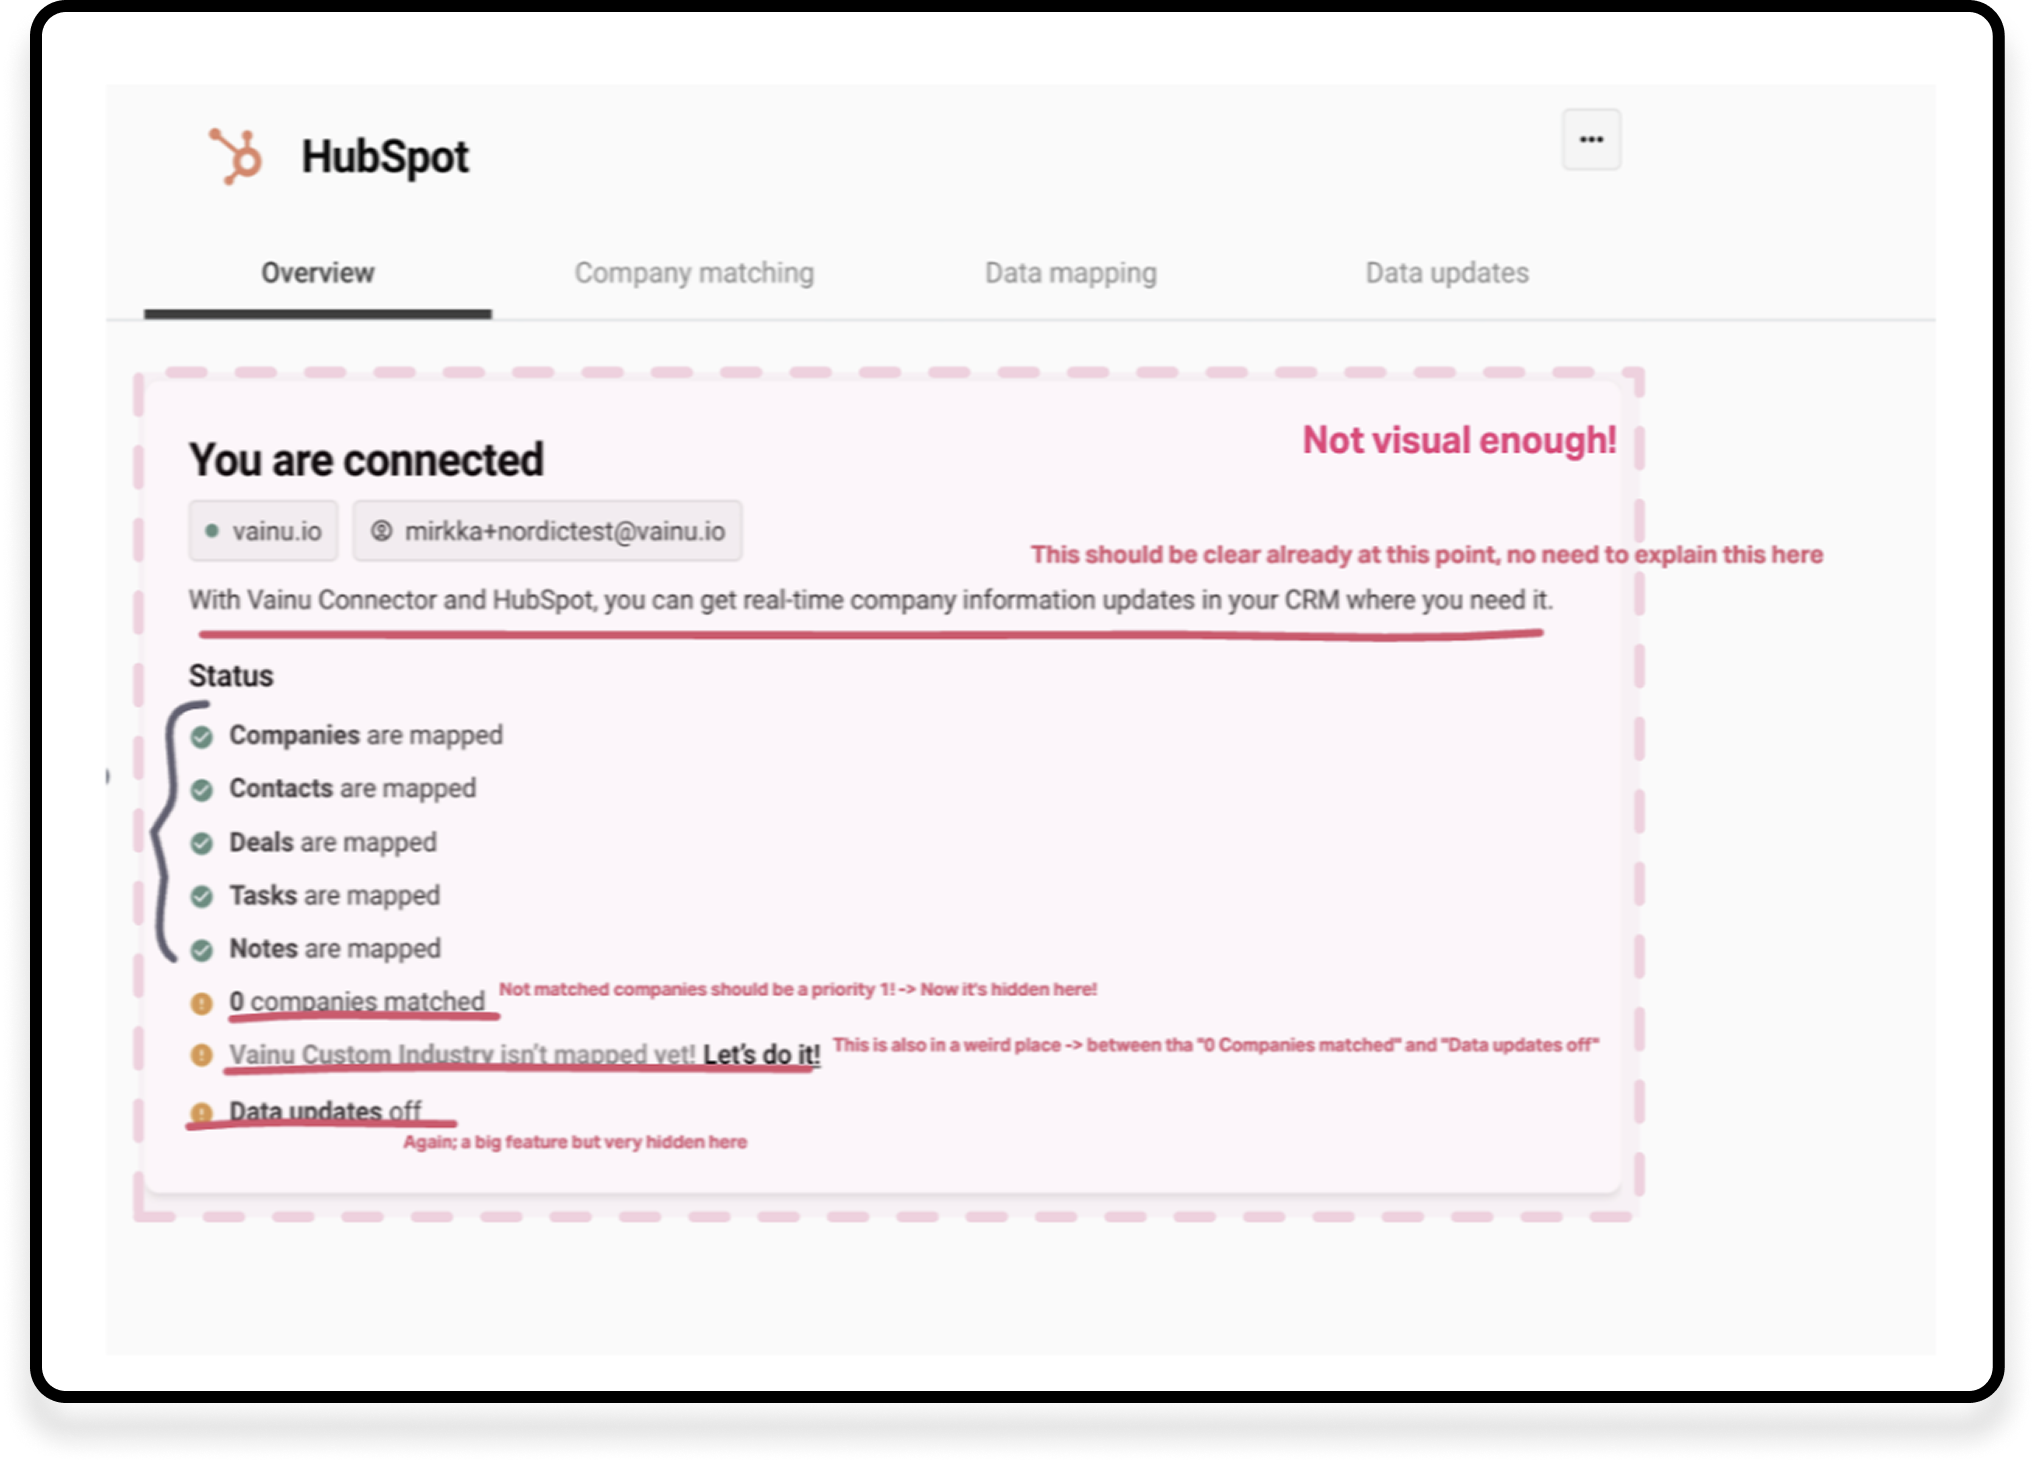
I reviewed the user feedback and took a closer look at what information the overview should communicate and where the main pain points were.
The view lacked visual hierarchy and a clear structure, making it difficult for users to see what was missing from their integration and quickly understand the overall status of their CRM connection.
3.What information do users actually need?
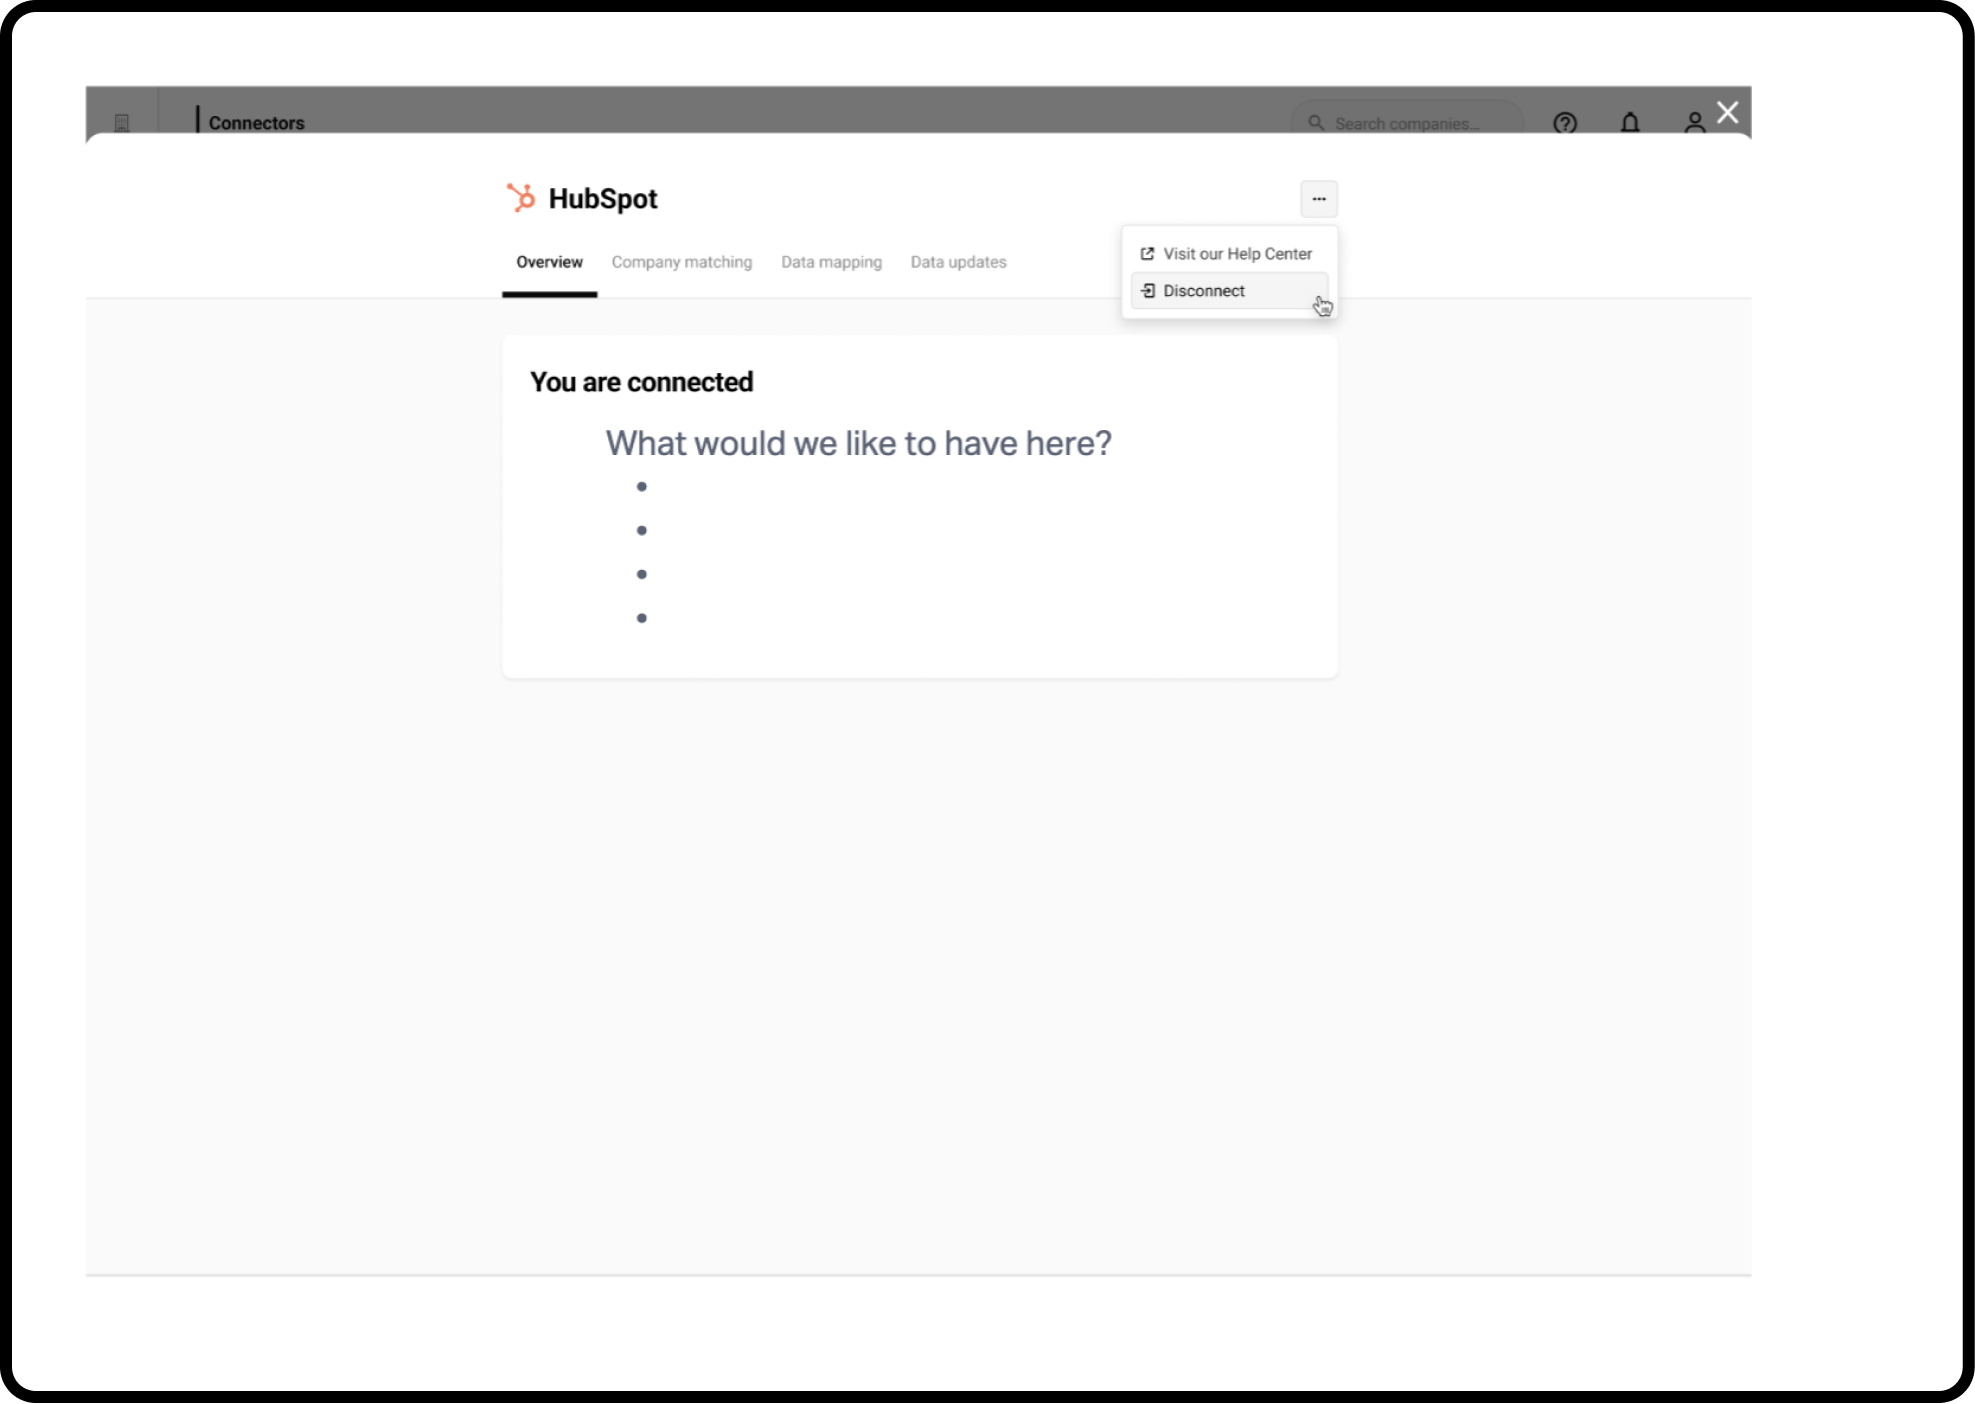
I started by identifying the key information users needed to quickly understand the status of their CRM connection.
4. Ideate solutions
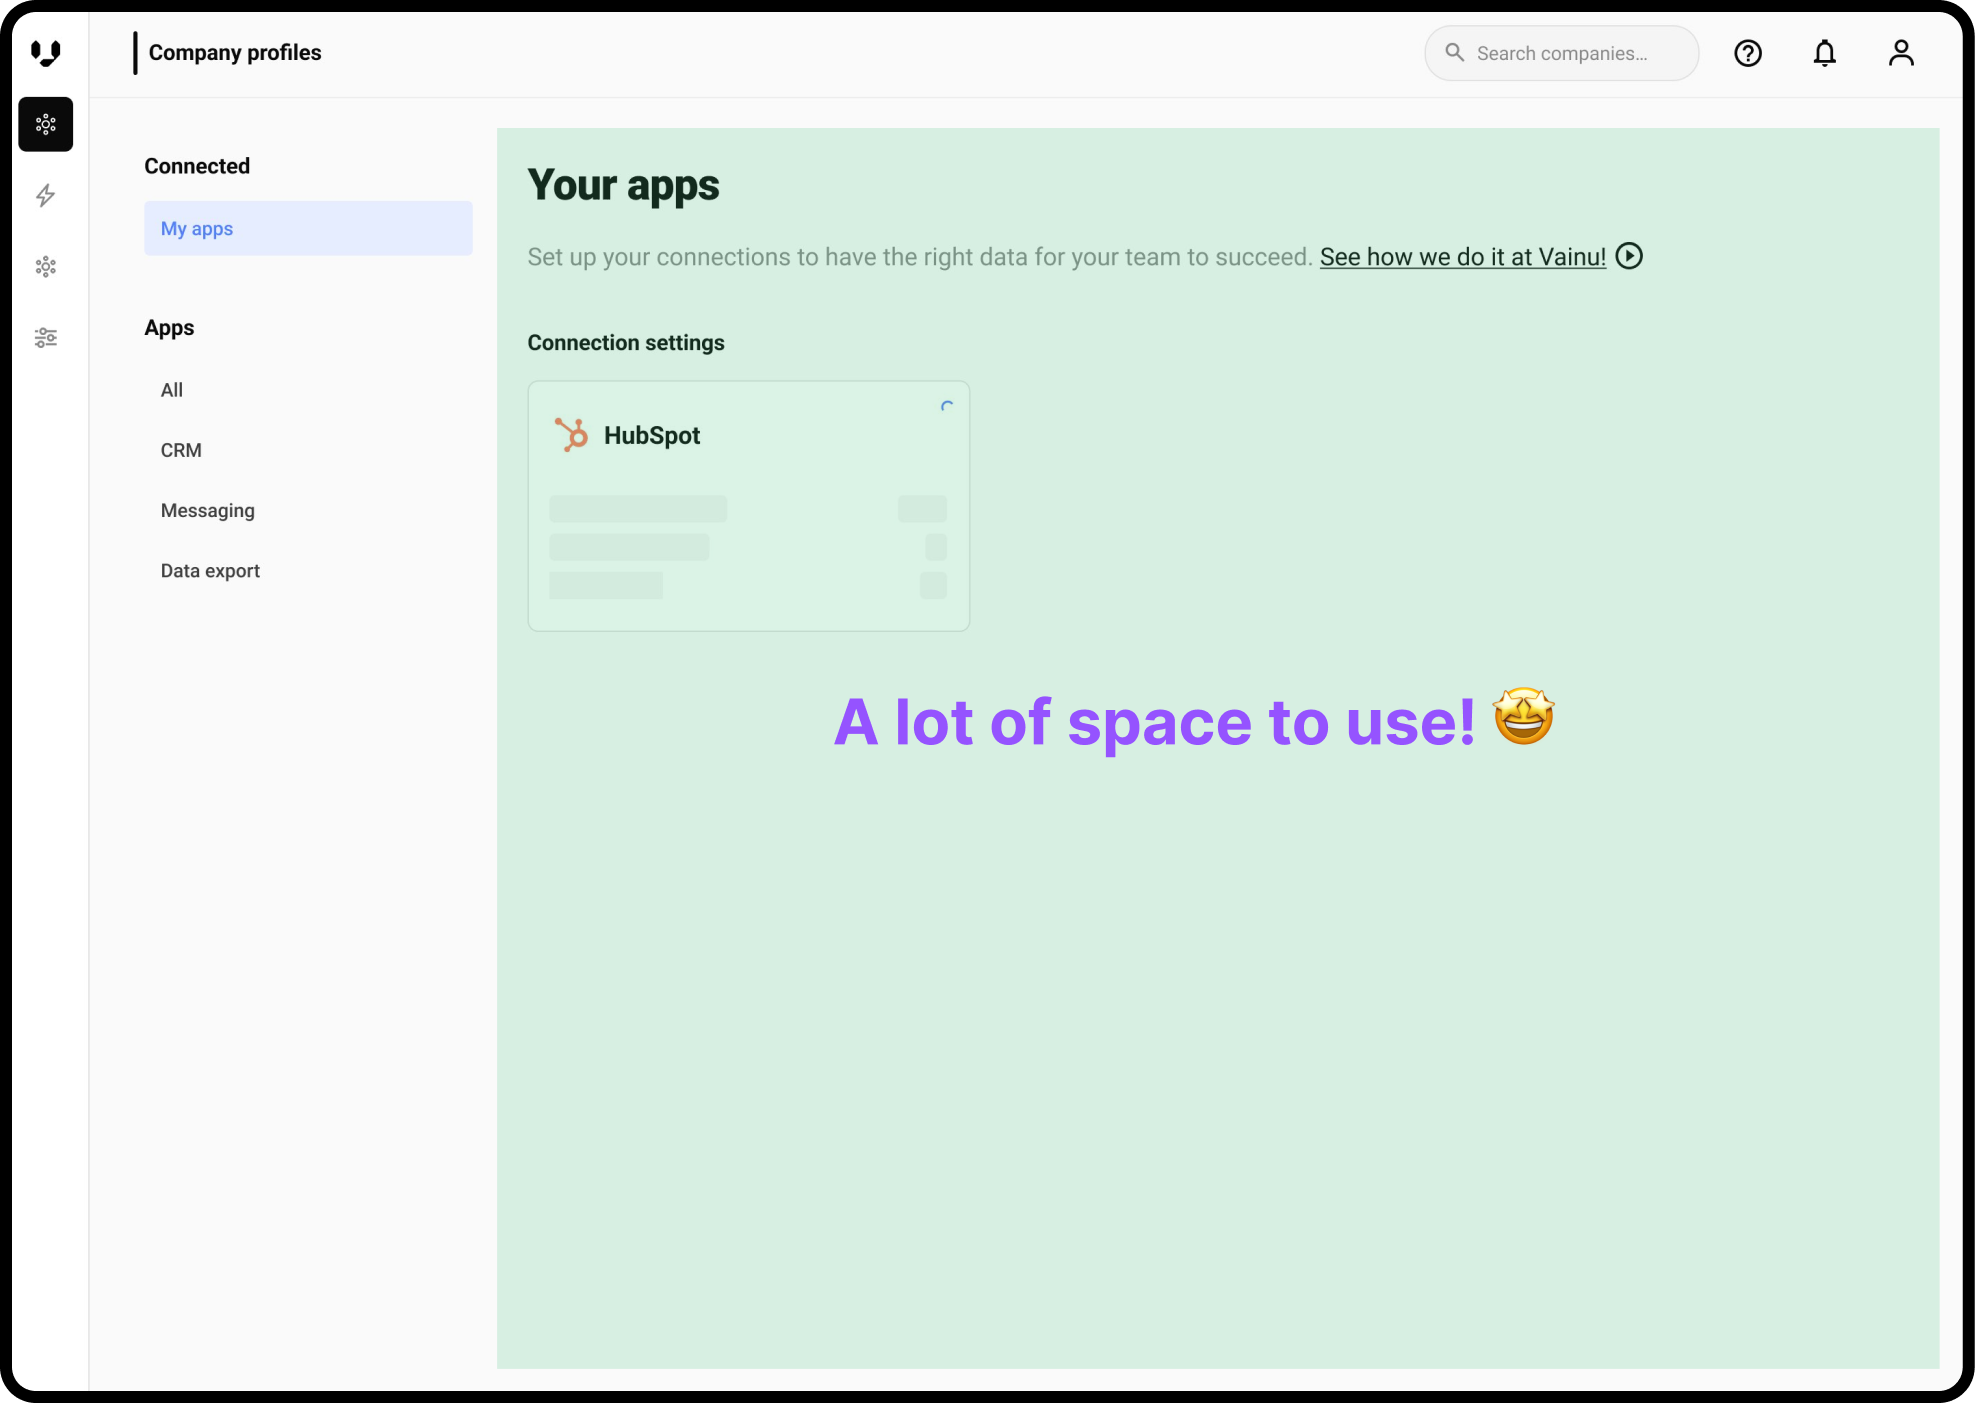
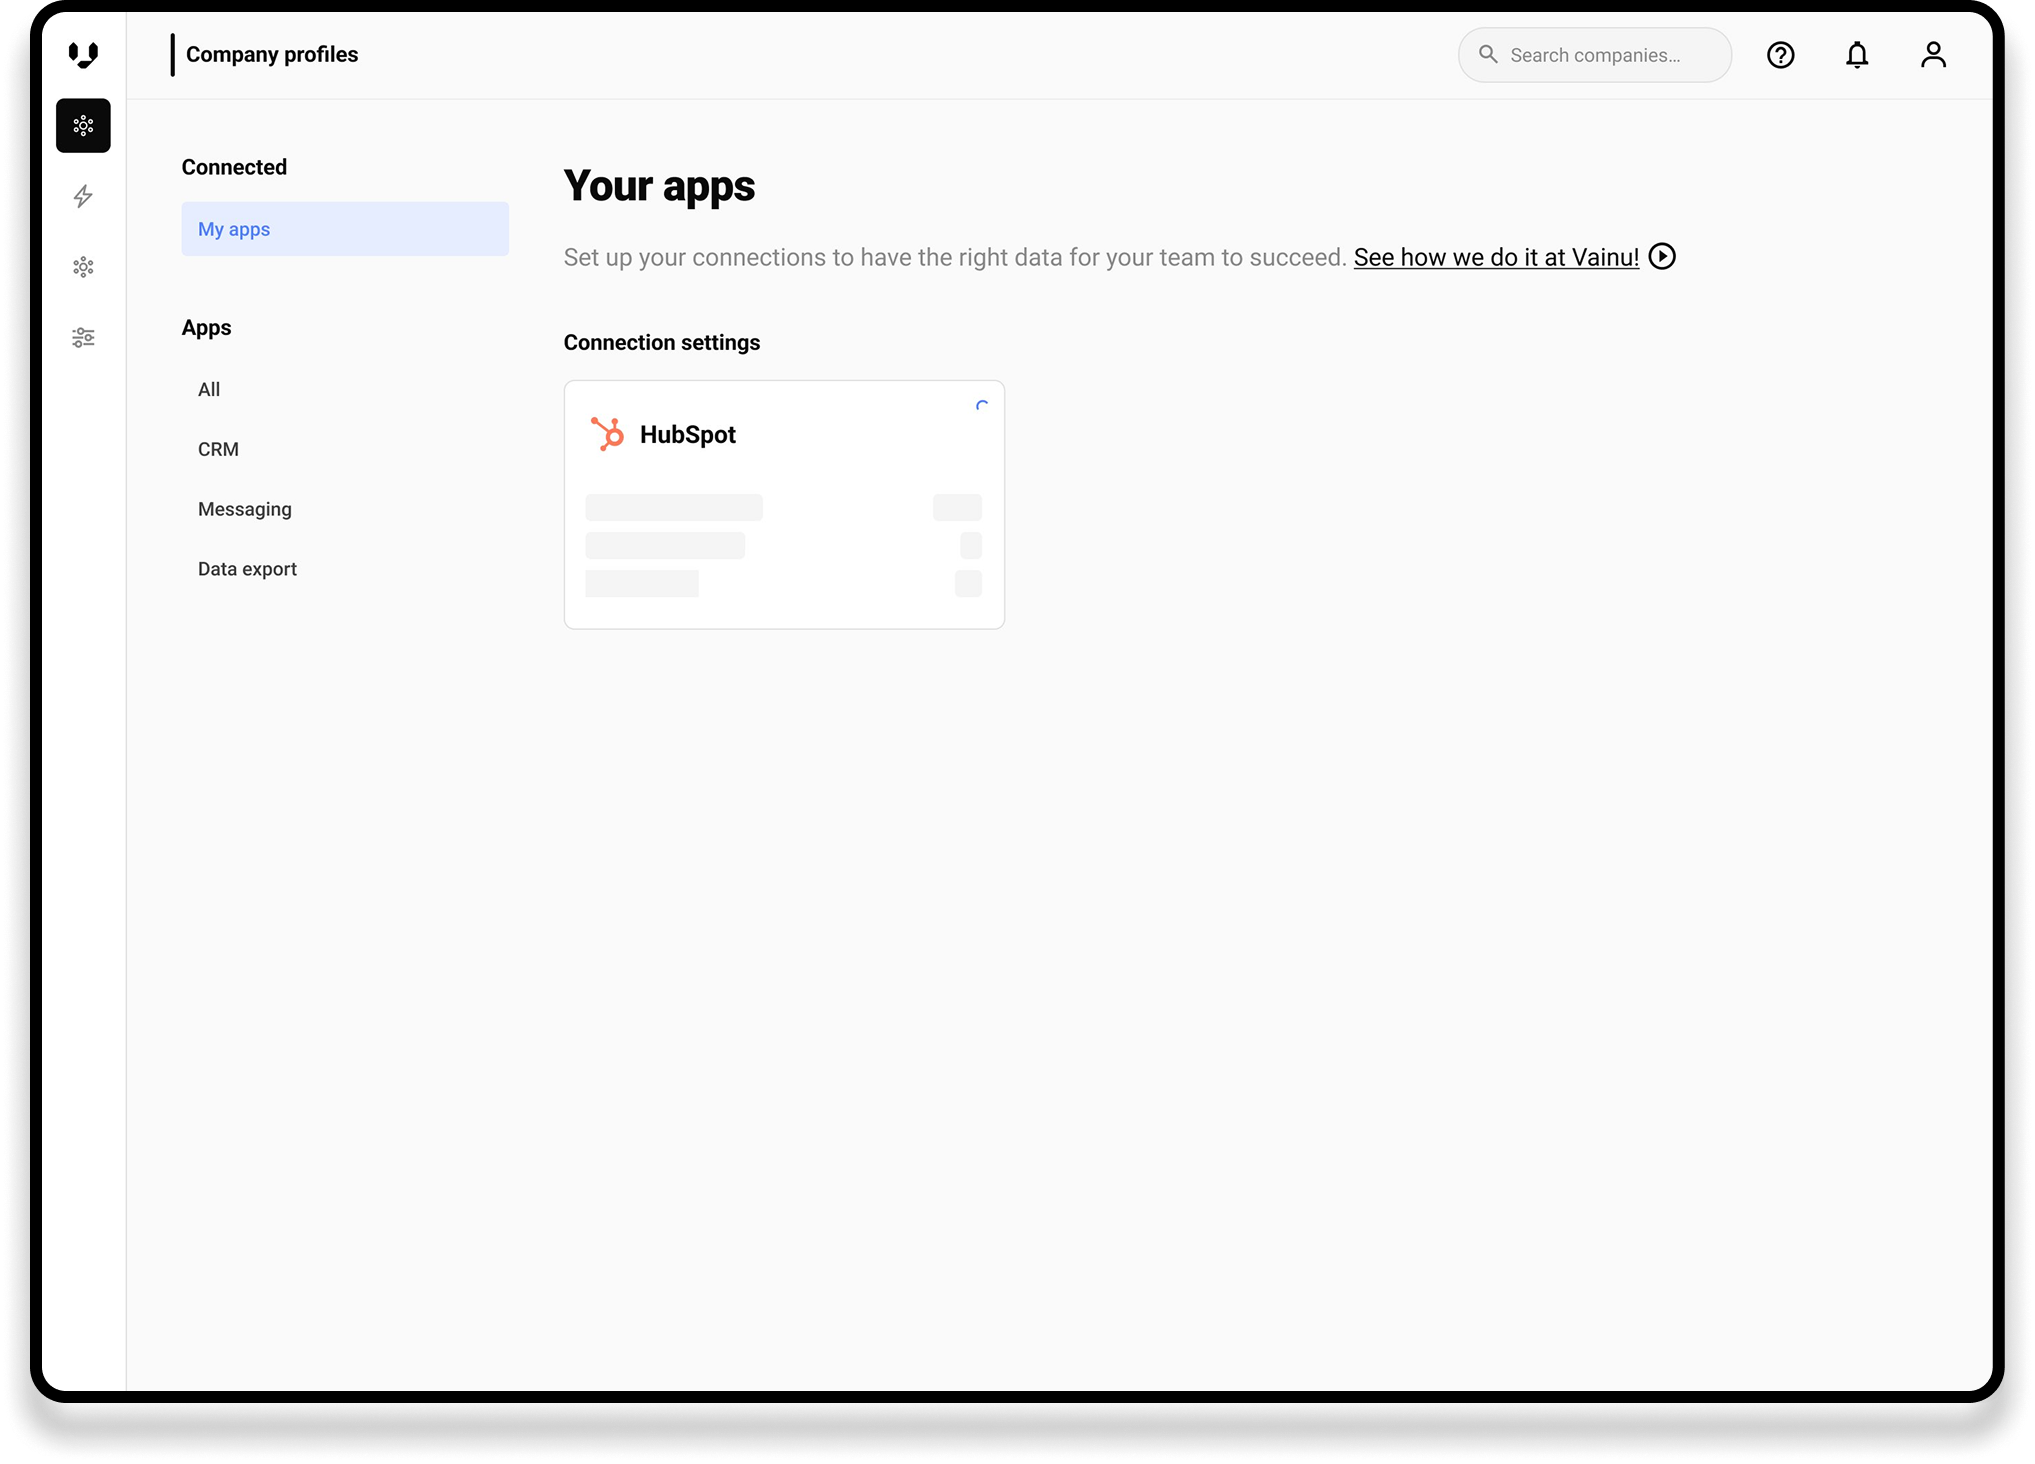
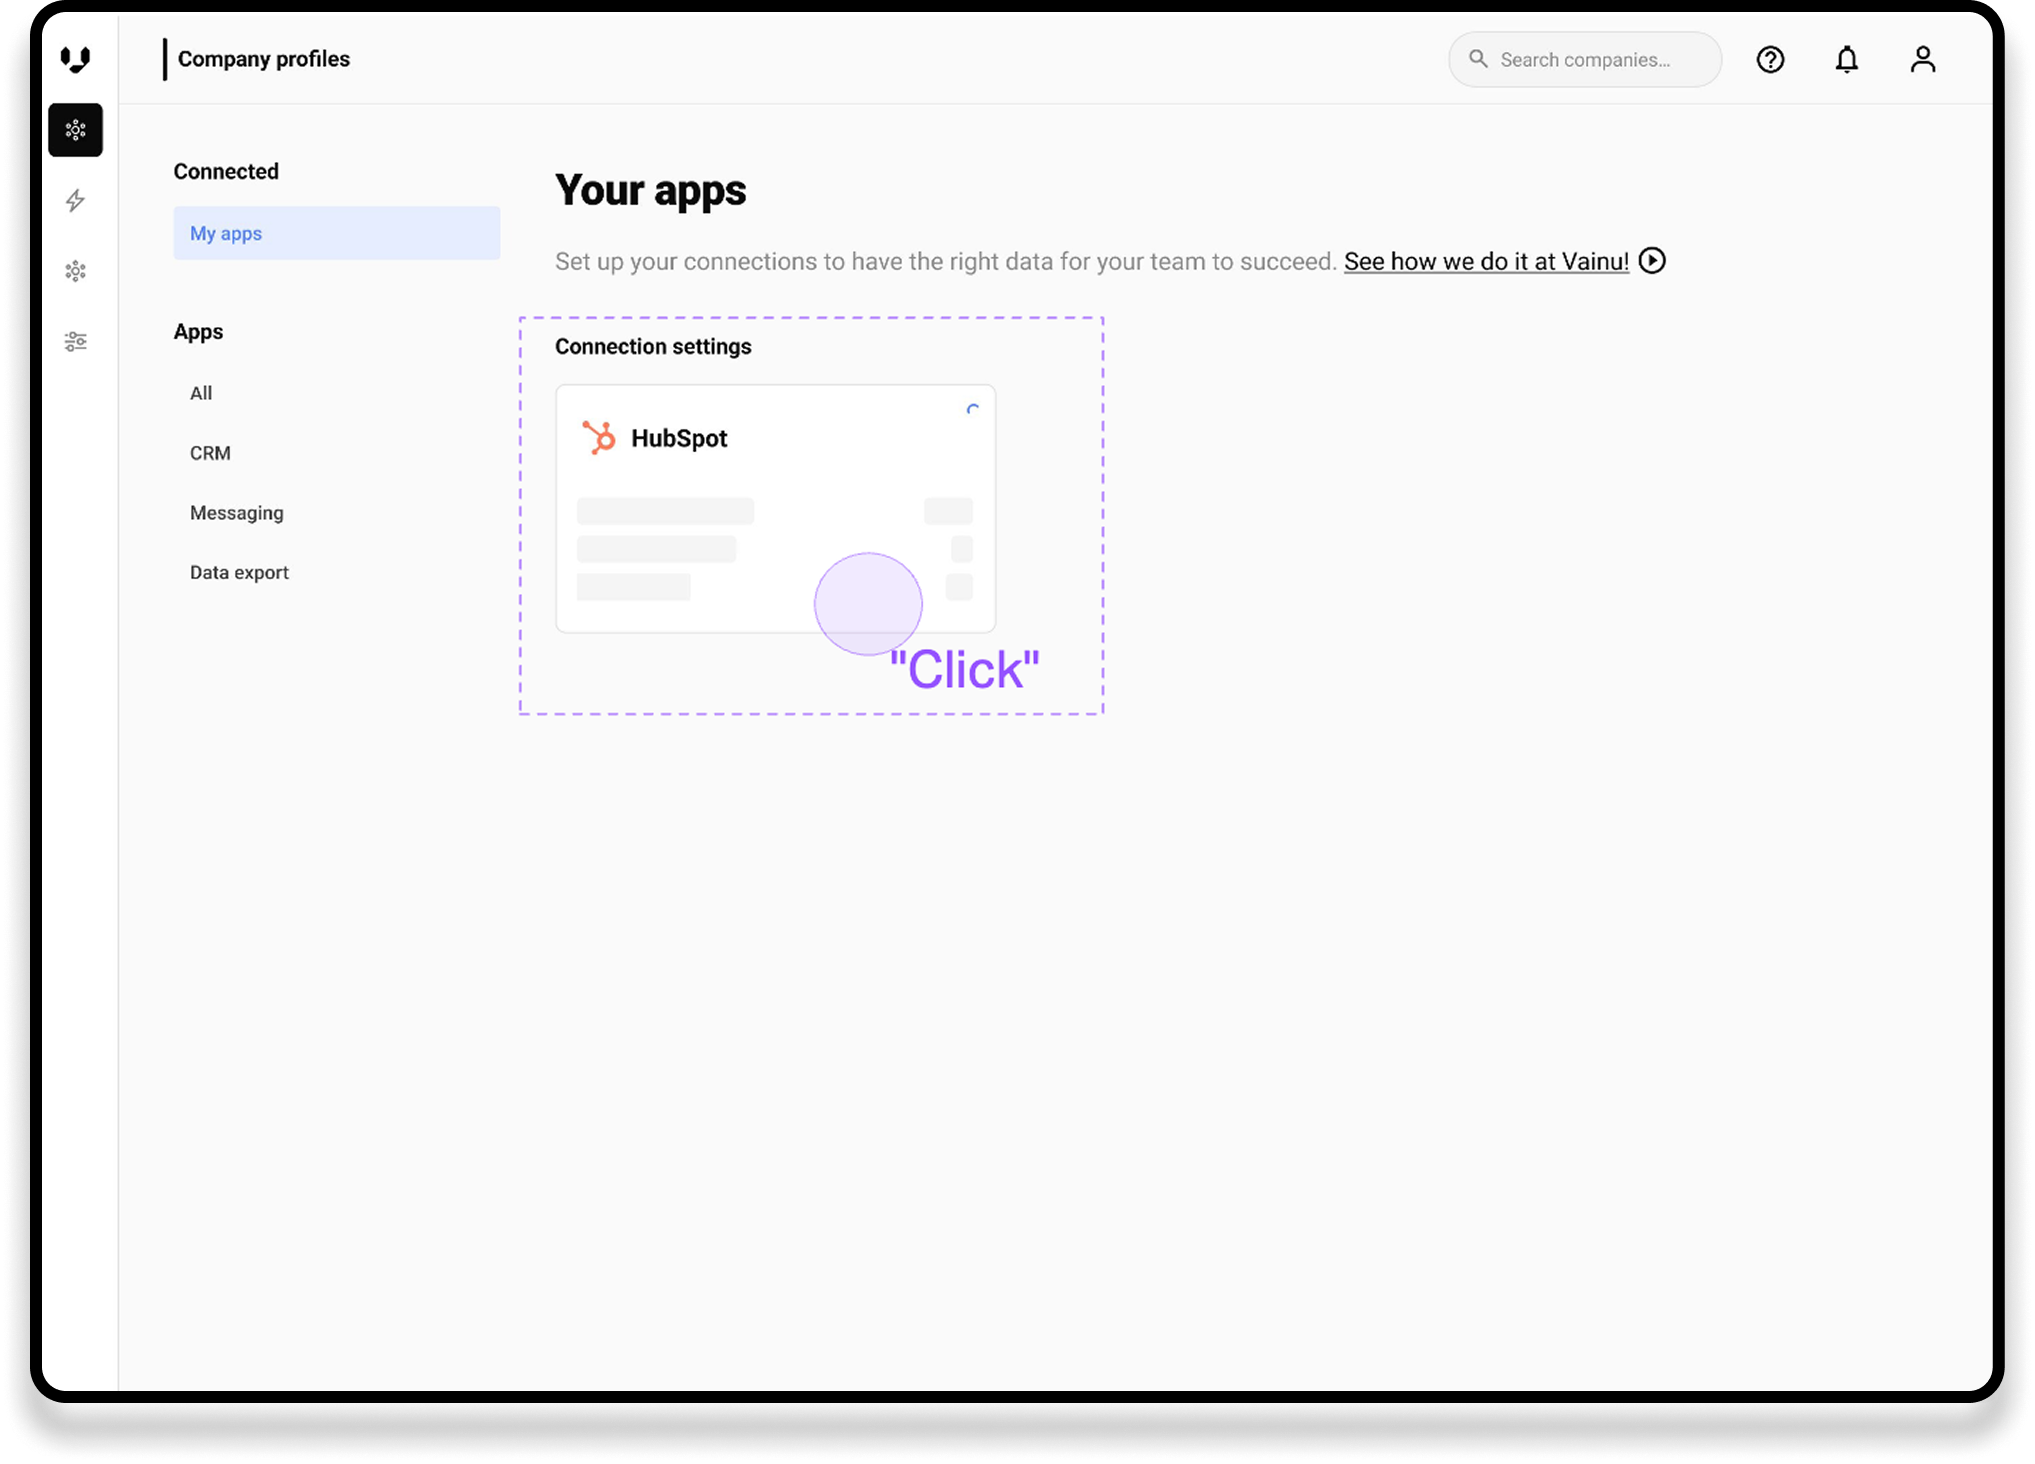
I noticed that the “My Apps” page—the first view users see when checking their integrations—had a lot of unused space. This created an opportunity to bring the integration overview directly into this view.
I started exploring ways to show the most important information here, allowing users to understand the status of their integrations immediately, without any extra clicks. They would only need to open the settings when something required their attention or they wanted to make changes.
5. Drafting and testing the idea
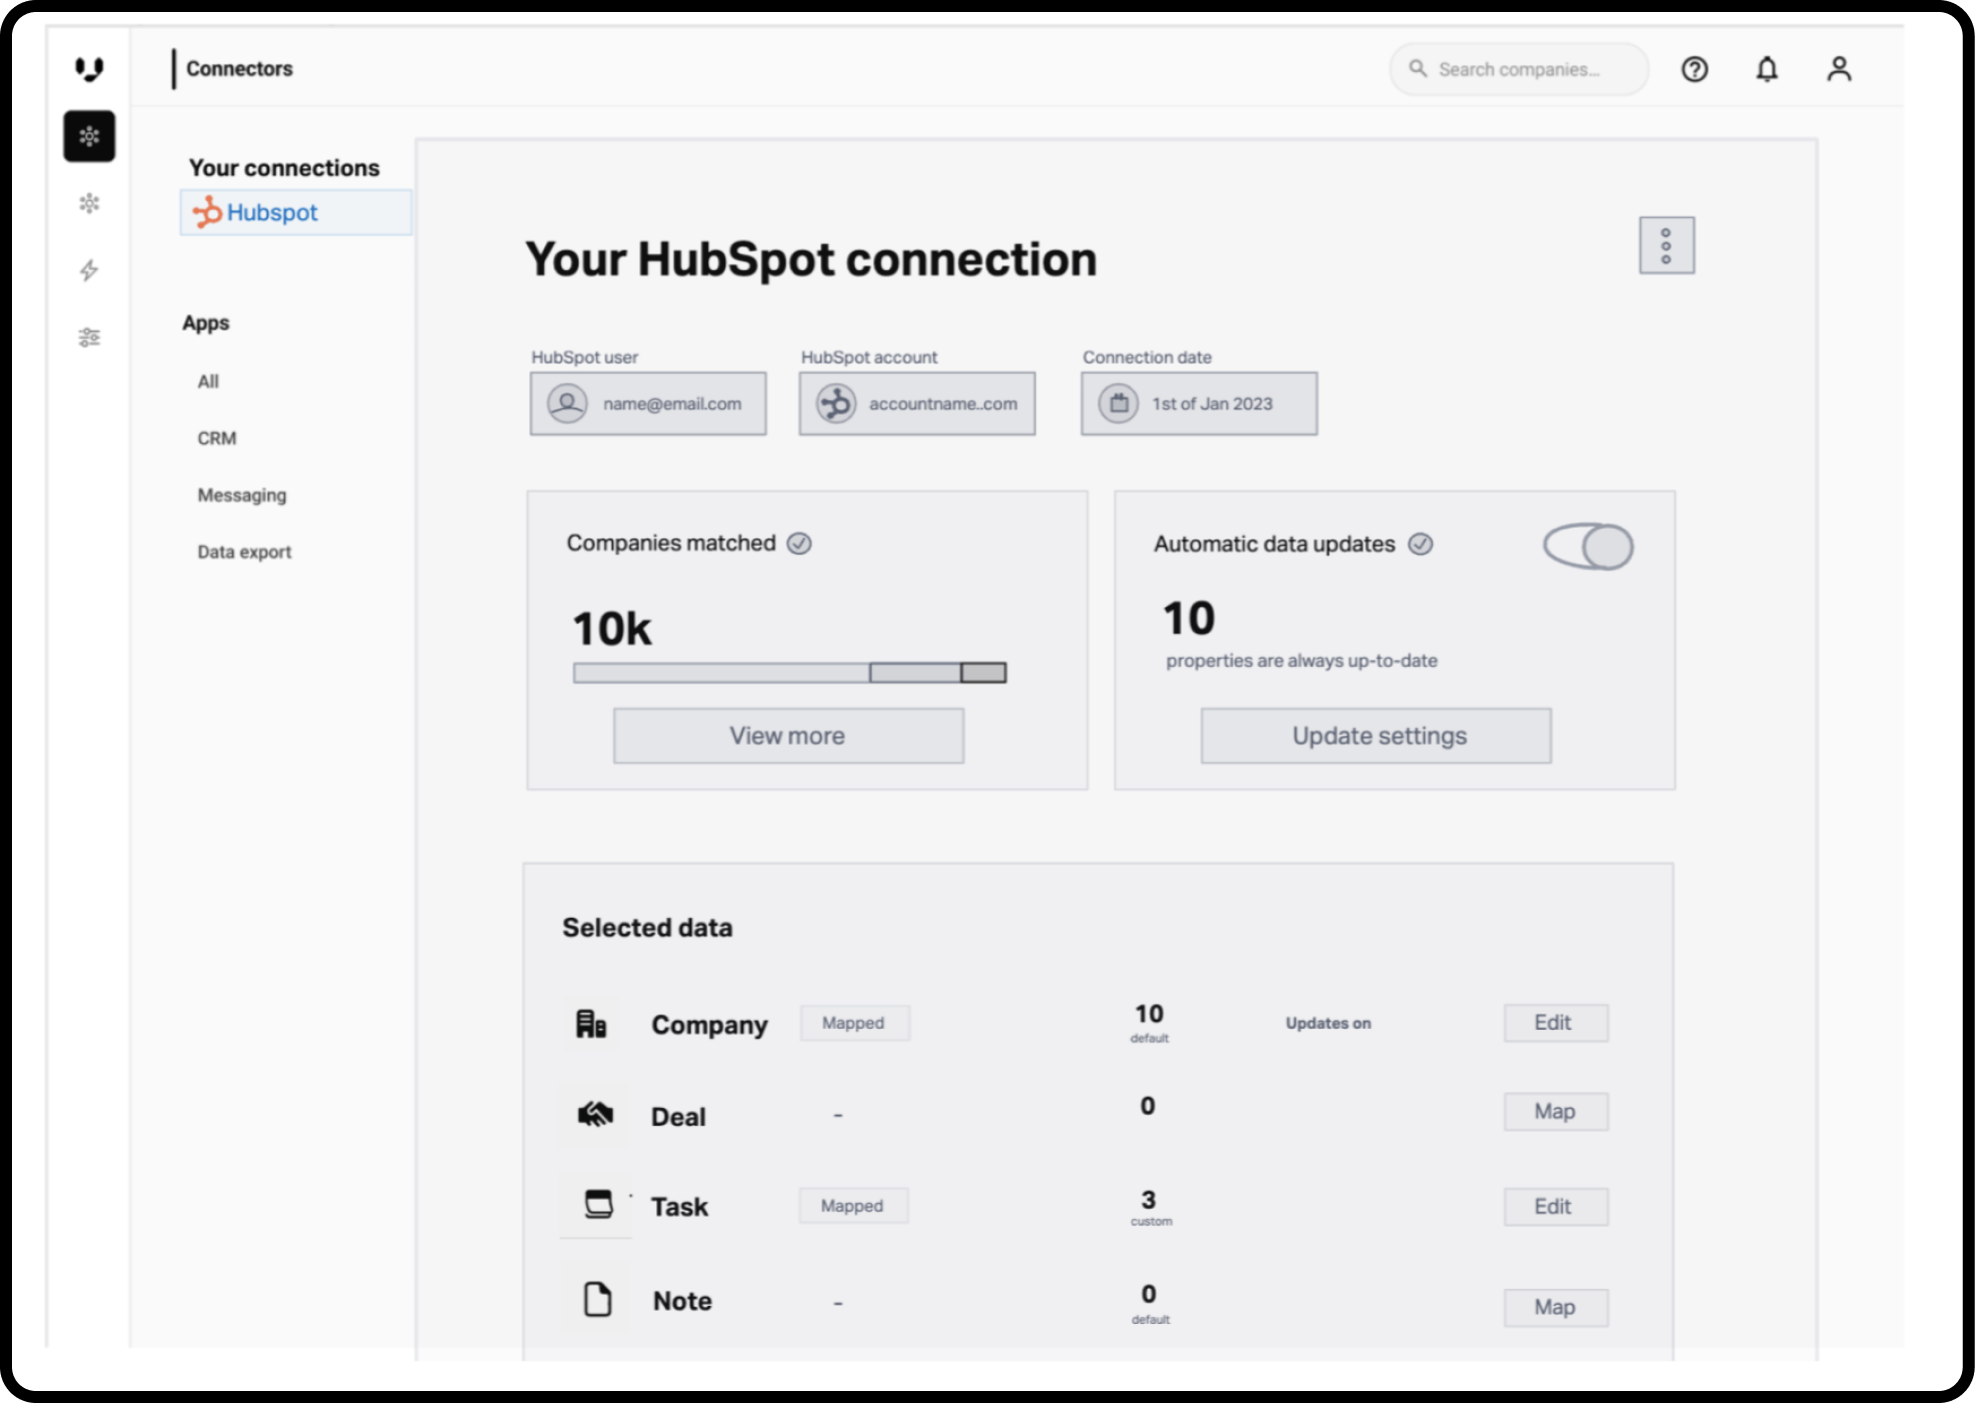
I started creating drafts in InVision to communicate the idea more clearly with the team and stakeholders. After getting the green light, I continued iterating on the concept to find the best solution.
At this stage, I usually review ideas with developers and other designers to make sure they’re feasible to build and to identify any technical limitations, risks, or other considerations early on.
It’s also a good point to start testing the concept with the people who will eventually use the feature, allowing us to validate the direction before moving further into detailed design.
Step 6: Final designs in Figma
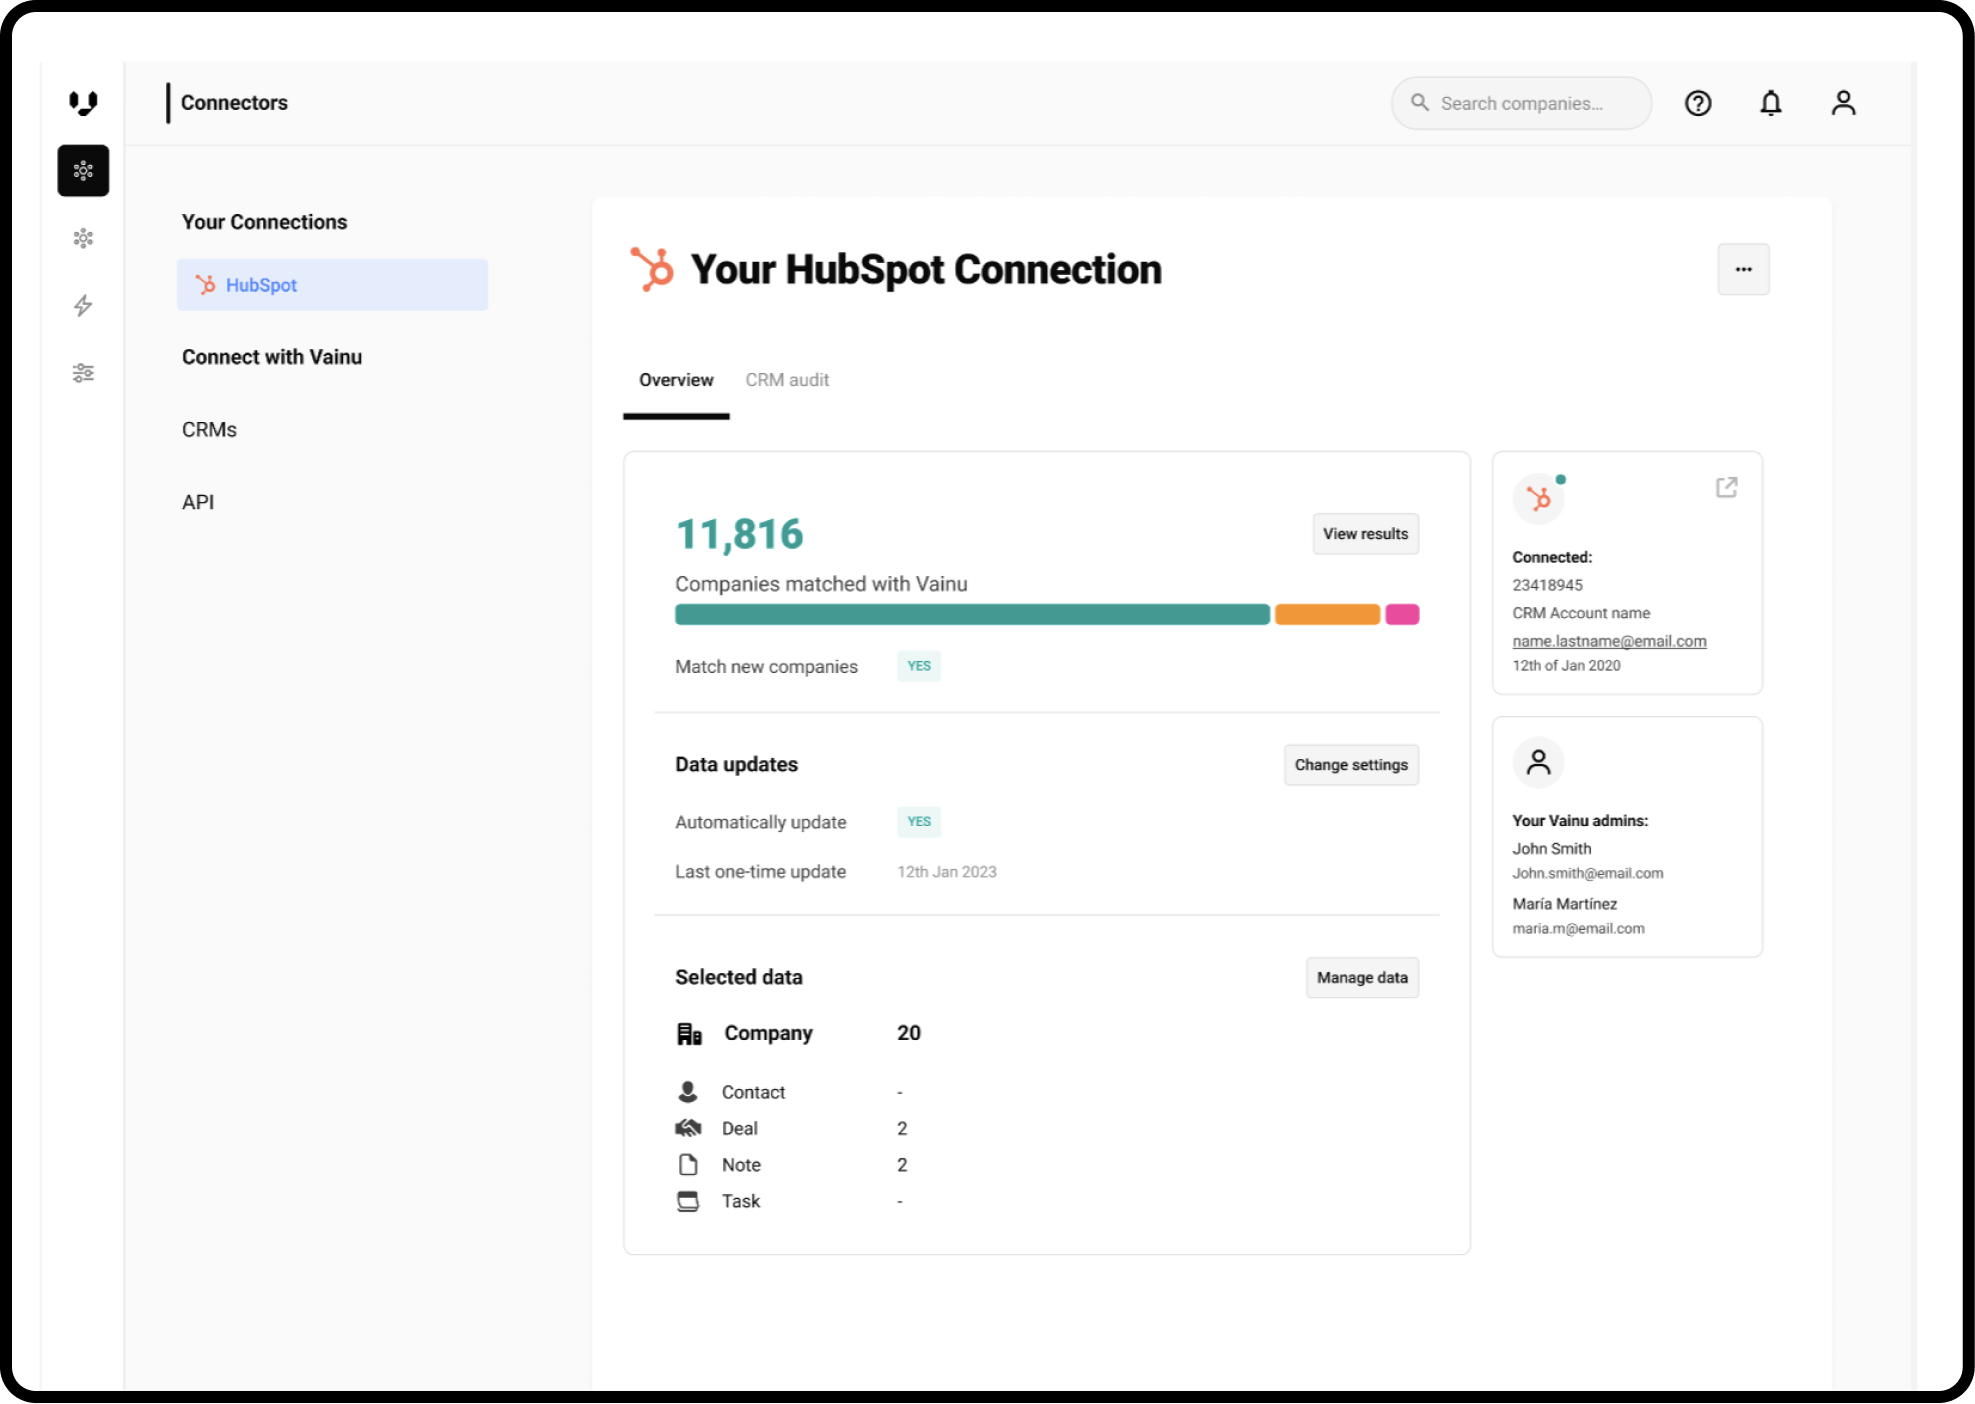
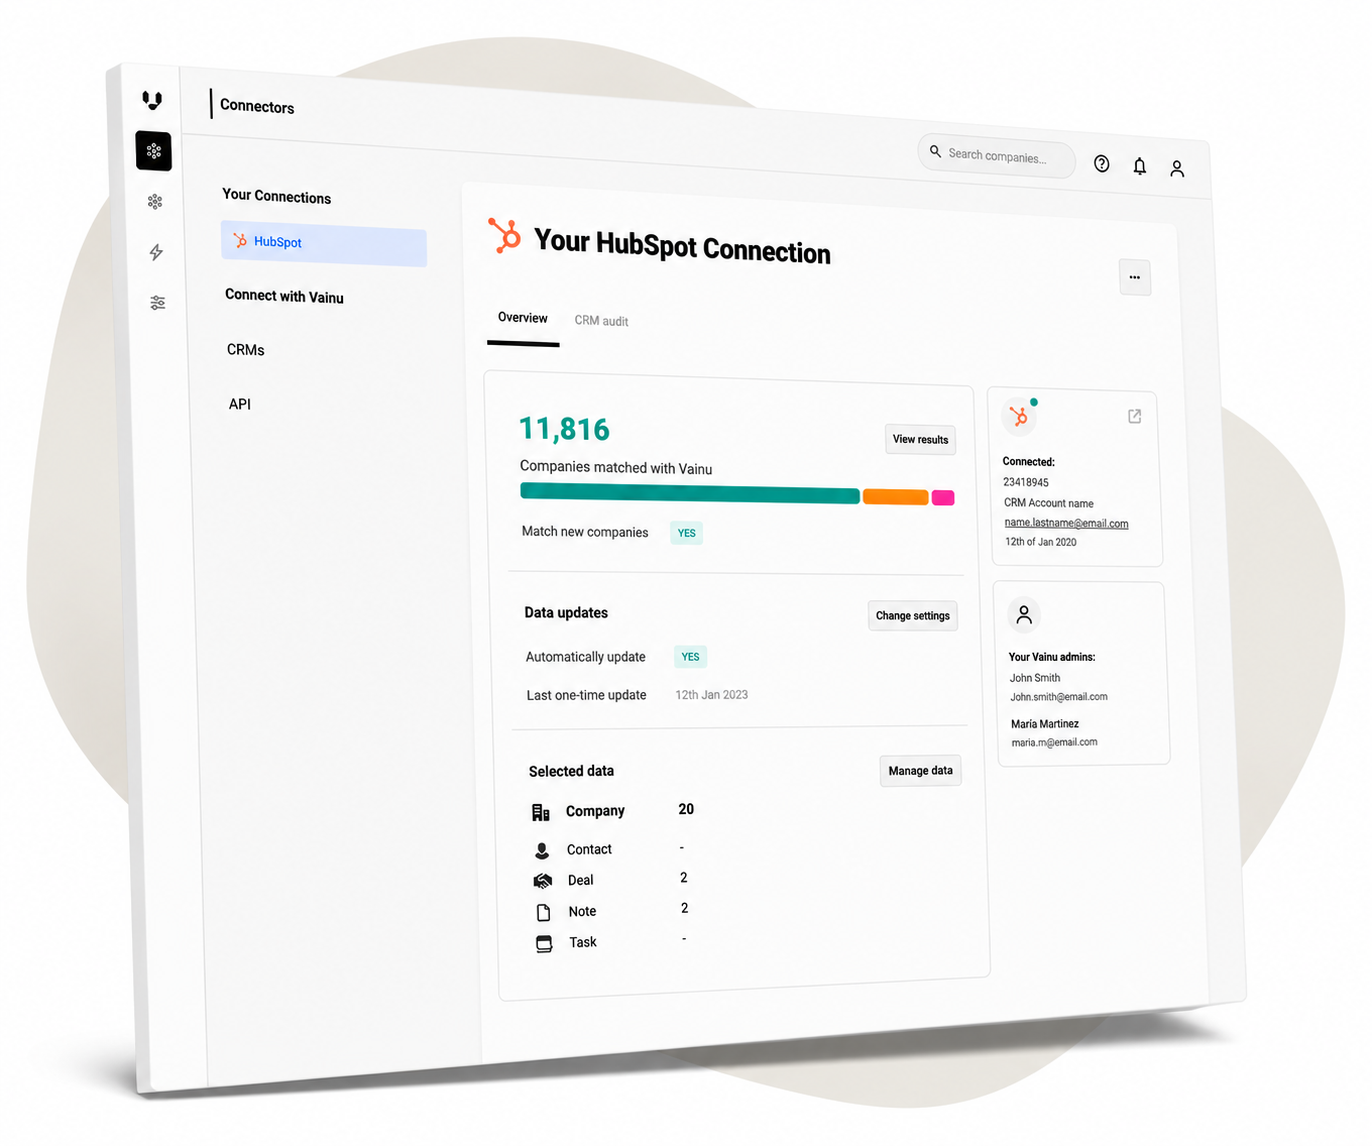
In the new version, the user can see immediately the status of each of the different settings:
How many companies are matched
What type of update settings are on
How many data points are selected for different objects
Possible error messages will be shown in the area the error has occurred and the user can go to that section of settings with one click.
Users can also see which CRM initial is connected with Vainu and who the admin is that can help with more advanced settings
Next steps
Gathering more user feedback and editing based on that
Building a CRM insights dashboard to support the connection information and to show the value of the product from the very beginning